


DIC数字图像相关技术原理 Digital Image Correlation
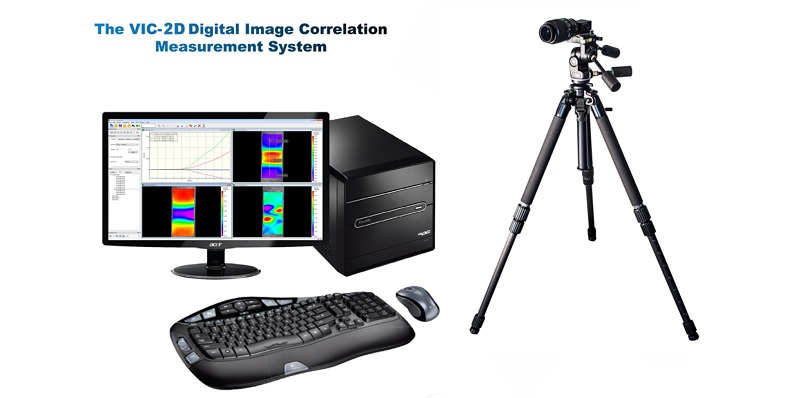
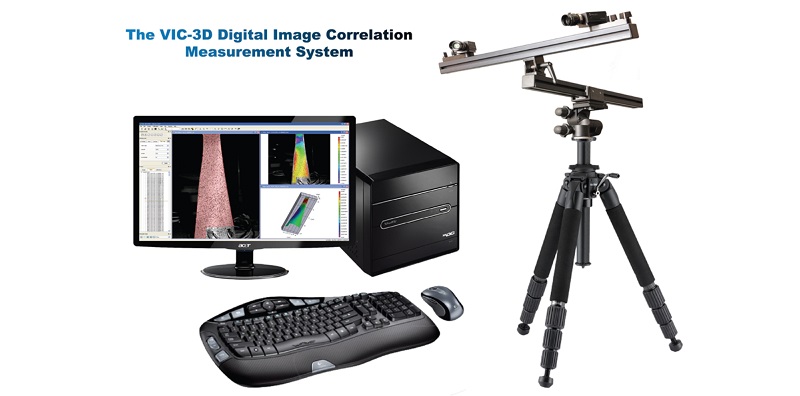
数字图像相关技术Digital Image Correlation(通常称为“DIC”)是一种易于使用的测量物体表面变形的光学方法。该方法是在变形过程中跟踪被称为像素子集(在下图中用红色表示)的相邻小区域中灰度值模式的变化进行测量。与已验证的FEA模型相对比,数字图像相关测量技术一再被证明是准确的。Correlated Solutions公司的商用VIC-2D和VIC-3D系统正是采用了这种先进的光学测量技术。
Digital Image Correlation (often referred to as “DIC”) is an easy to use optical method which measures deformation on an object’s surface. The method tracks the changes in gray value pattern in small neighborhoods called subsets (indicated in red in the figure below) during deformation. Digital Image Correlation has repeatedly proven to be accurate when compared to valid FEA models. The commercially available VIC-2D and VIC-3D systems from Correlated Solutions utilize this advanced optical measurement technology.
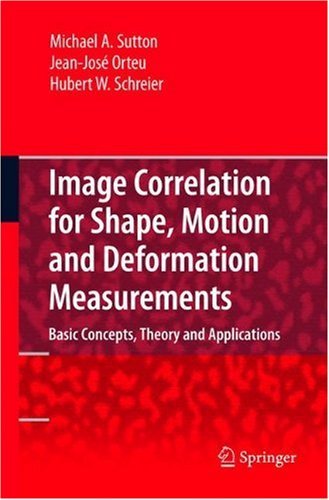
DIC原理书籍 / Digital Image Correlation Book
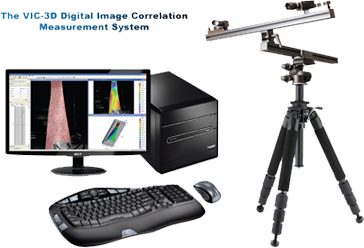
DIC原理概述 / Digital Image Correlation Overview

2D应用案例 / Two-dimensional Example
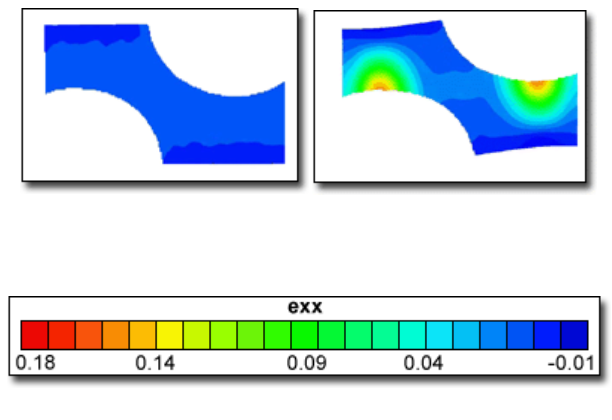
下面的两张照片显示了带有两个偏移半圆形切口的铝制试件上的散斑图案。 这两张照片是从一组动画照片中提取的,左侧是拍摄开始时的图像,右侧是拍摄结束时的图像。 由于变形主要在平面内,所以可以使用单个图像采集器来测量变形。
The two pictures below show a speckle pattern on an aluminum sample with two offset semi-circular cut-outs. The two pictures were taken from an animation with the left image taken from the beginning and the right picture taken from the end of the animation. Since the deformation is predominantly in-plane, a single camera can be used to measure the deformation.

Small Deformation
|
 Large Deformation |
下面的图片显示了上述照片通过2D图像相关性测量的水平应变信息。
The pictures below show the horizontal strain measured by two-dimensional image correlation for the pictures shown above.
3D应用案例 / Three-dimensional Example
下面的两个散斑图像由3D系统的左右相机同时拍摄。试件本身是一块玻璃,CSI公司的Logo贴纸粘在表面上。散斑图案采用标准的市面可售的白色和黑色喷漆绘制。您能轻易分辨清楚形状吗?
The two speckle images below were taken simultaneously with the left and right camera of a stereo-system. The sample itself is a piece of glass with our company logo sticker adhered to the surface. The speckle pattern was applied using standard off-the-shelf flat white and black spray paint. Can you make out the shape?
|
左视角Left View
|
右视角Right View
|
下图显示了使用VIC-3D系统测量的Logo贴纸的形状。测得Logo贴纸的厚度约为0.003“即0.070mm。
The plot below shows the shape of the logo sticker measured with the VIC-3D System. The thickness of the logo sticker is approximately 0.003″ or 0.070mm.
3D应用案例: 铝合金狗骨样件拉伸试验 / 3-D Example Application: Aluminum Dog-bone Tensile Sample
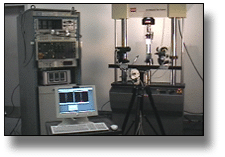
The first picture on the left shows the test setup for 3D image correlation measurements on an aluminum dog-bone sample. The VIC-3D measurement system is connected to the load ouput of the test frame controller and records load data synchronously with the images.

左边的特写显示3D系统的两个图像采集器聚焦在样件上。试件使用光纤鹅颈式灯光进行照明,可以方便地进行调节,以在整个试件上提供均匀的照度。
The close-up on the left shows the two cameras of the stereo system focused on the sample. The sample is illuminated using fiber-optic goose-neck style lights that can conveniently be adjusted to provide even illumination across the entire sample.
散斑图案 / Speckle Images

 右侧的两幅图像分别显示了由3D系统的左侧和右侧相机拍摄的未变形状态下的狗骨试件散斑图像。
显示的试件是0.5“宽和0.1”厚。标距长度是5“。
散斑图案是使用自喷漆制作的,首先用一层白色涂料喷涂覆盖铝试件。 然后通过轻轻地喷涂黑漆雾来制备黑色散斑。
The two images on the right show the speckle images of the dog-bone sample in the undeformed state recorded by the left and right camera of the stereo system, respectively.
The sample shown was 0.5″ wide and 0.1″ thick. The gage section was 5″ in length.
The speckle pattern was applied by first coating the aluminum sample with a layer of white paint using a spray can. The black speckles were then applied by lightly over-spraying a black mist of paint.
试件颈缩 / Specimen Necking
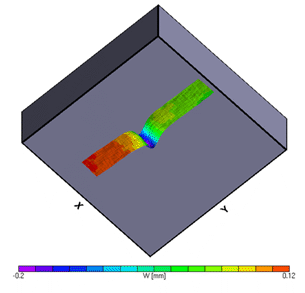
下图显示了失效前试件上的彩色云图的离面位移(W值)。试件最终破坏发生时显示出典型的局部颈缩特征。
The graph below shows the out-of-plane displacement (W) as a color-coded overlay on the sample just prior to failure. The sample showed the typical localized necking where ultimately failure occurred.
应力-应变曲线 / Stress-Strain Curve
 右侧图片显示了试件的应力 - 应变曲线。测得的应变是大约1/8"标距长度上的区域平均值。
The stress-strain curve for the sample is shown on the right. The measured strains were averaged over an area corresponding to a gage length of approximately 1/8″.
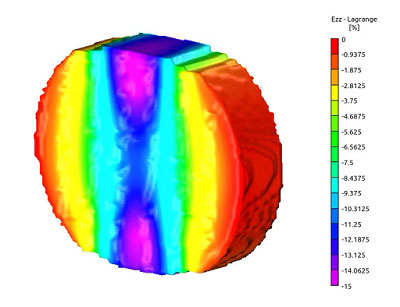
由于VIC-3D计算试件表面上的拉格朗日应变张量,横向应变可用在基于体积守恒约束计算的样品横截面积减小。 在右侧的图中,以绿色显示的是用减小的横截面积计算的实际应力 - 应变曲线。
Since VIC-3D calculates the Lagrangian strain tensor on the specimen surface, the transverse strain can be used to calculate the reduction in cross-sectional area of the sample using a volume conservation constraint. In the graph on the right, the actual stress-strain curve using the reduced cross-sectional area is shown in green.