登录 注册
  • DIC测量与检测
      • VIC-2D平面应变场测量
        • VIC-2D SEM 扫描电镜应用
        • VIC-2D 平面应变场测量
         
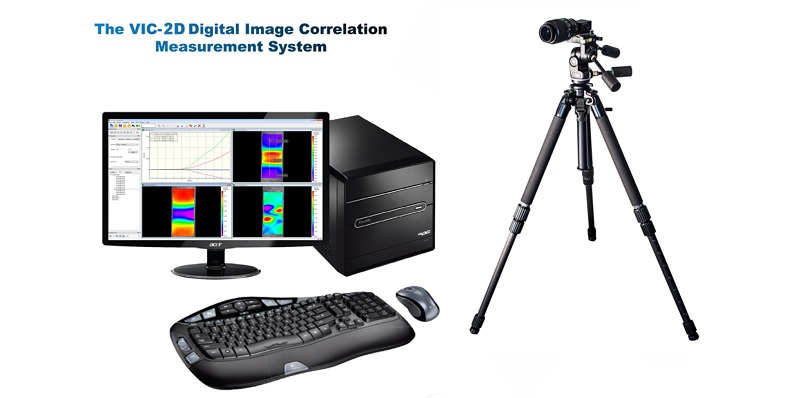
        美国Correlated Solutions Inc.公司是全球DIC技术的创始者,也是行业顶尖技术的领导者。
        现在Vic-2D系统处理速度已超过150,000数据点/秒,并支持光学畸变与SEM扫面电镜漂移校正。
         
        当您可以用我们的DIC系统很容易地获得定量的数据时, 请不要再满足于定性分析!
        Don't settle for qualitative data when you can easily quantify it with our DIC systems!

        申请试用我们的产品

      • VIC-3D表面应变场测量
        • VIC-EDU System 教学版
        • VIC-3D High-Speed 高速测量
        • VIC-3D Ultra High-Speed 超高速测量
        • VIC-3D Real-Time 实时全场应变
        • VIC-3D IR 温度场耦合测量
        • VIC-Gauge 视频引伸计/应变仪
        • Marker Tracking 被动标志点追踪测量
         
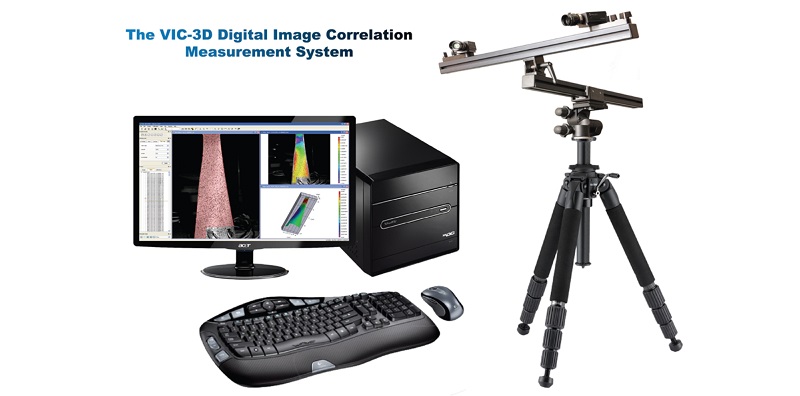
        美国Correlated Solutions Inc.公司是全球DIC技术的创始者,也是行业顶尖技术的领导者。
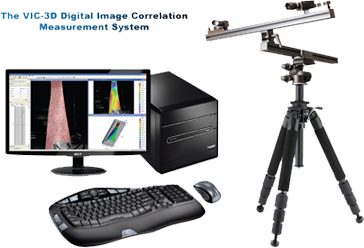
        Vic-3D测量系统具有行业顶尖的精度、可靠性与可重复性,满足科研用户各种复杂的测量需求。
         
        当您可以用我们的DIC系统很容易地获得定量的数据时, 请不要再满足于定性分析!
        Don't settle for qualitative data when you can easily quantify it with our DIC systems!

        申请试用我们的产品

      • VIC-3D疲劳场与振动测量
        • VIC-3D HS-FFT 高速振动与ODS
        • Vibration Fatigue 稳态与疲劳
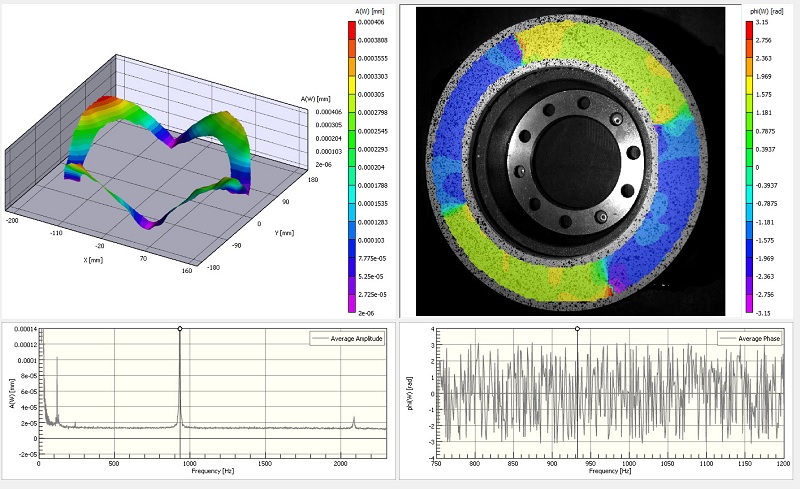
        无论是瞬态事件测量还是周期性的稳态振动测量,VIC-3D系统均可提供相匹配的DIC测量解决方案。
         
        当您可以用我们的DIC系统很容易地获得定量的数据时, 请不要再满足于定性分析!
        Don't settle for qualitative data when you can easily quantify it with our DIC systems!

        申请试用我们的产品

      • VIC-VOLUME体应变测量
        • VIC-Volume 体应变/内应变
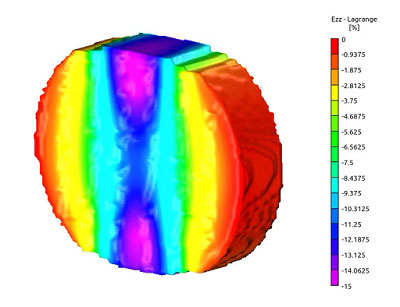
        美国Correlated Solutions Inc.公司的VIC-VOLUME体应变/内应变测量软件是行业独一无二的材料、结构内部应变分析软件,主要结合CT/MRI等断层扫描设备的图像数据使用。
         
        当您可以用我们的DIC系统很容易地获得定量的数据时, 请不要再满足于定性分析!
        Don't settle for qualitative data when you can easily quantify it with our DIC systems!

        申请试用我们的产品

      • VIC-3D图像采集系统
        • VIC-3D-Micro-DIC 小尺度图像采集
        • VIC-3D Micro 立体显微图像采集
      • VIC系统附件与辅助功能
        • Calibration 标定功能与硬件
        • Vic-Snap Remote 无线图像采集控制
        • VIC-Speckle Kit 散斑制备工具

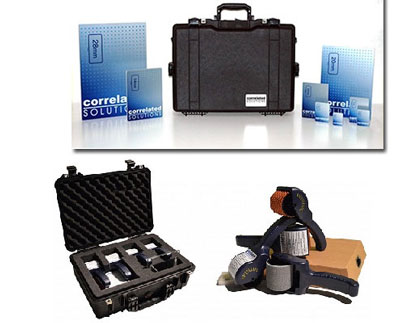
        可用于提高DIC测量精度与效率的软、硬件工具尽在于此!


        当您可以用我们的DIC系统很容易地获得定量的数据时, 请不要再满足于定性分析!

        Don't settle for qualitative data when you can easily quantify it with our DIC systems!

      • Psylotech介观尺度/原位加载系统
        • µTS_显微镜/扫描电镜原位加载系统
        • xTS_CT原位加载系统

        µTS是独特的适用于纳米压头和宏观万能加载系统之间的介观尺度微型万能材料试验系统,可通过数字图像相关软件(DIC)和显微镜结合的非接触式测量来获取局部的应变场数据。


      • isi-sys复材缺陷激光无损检测
        • Shearography / ESPI 激光无损检测

        Shearography / ESPI技术的激光无损检测系统,用于复合材料与结构的非破坏性强度和缺陷检测。

      • MML原位微纳米力学测试系统
  • 仿真建模与计算
      • SIMULIA 仿真模拟

        请访问我们的仿真计算软件平台

        acqtec.com.cn

      • BIOVIA 材料与生命科学

        请访问我们的仿真计算软件平台

        acqtec.com.cn

      • CATIA 设计
      • 专用后处理模拟方案
        • VISCA™ 聚合物仿真模拟解决方案
        VISCA™ -Advanced Nonlinear Viscoelastic Polymer Modeling
        来自美国Psylotech公司的高级非线性粘弹性聚合物仿真建模解决方案
  • 解决方案
      • 产品解决方案
        • DIC 实验教学 Educational System
        • 介观尺度原位加载试验 Meso-Scale
        • 复合材料无损检测 NDT
        • 混合型粘结断裂试验方案 Psylotech
        • 振动与ODS测量 VIC-3D HS-FFT
        • 稳态振动分析 VIC-3D Fulcrum
        • 全场数据实时测量 VIC-3D Real-Time
        • 温度-应变耦合测量 VIC-3D IR
      • 行业解决方案
        • 航天环境与强度测试 Aerospace
        • 航空材料与结构可靠性测试 Aviation
        • 汽车行业 Automotive
        • 新能源领域 New Energy
        • 医学与生物力学应用 Biomechanics
      • 参考客户
        • 参考客户 Reference Customers

        全球用户


  • 工程与科研服务
    • DIC测量数据服务
    • 残余应力测量
    • 科研数据分析
  • 支持与下载
    • 申请试用
    • 手册与彩页
    • 试用下载
    • Online资料与培训
    • 培训与支持申请
    • 常见问题 Q_A
  • 新闻与活动
    • 活动计划
    • 公司新闻
    • 行业新闻
  • 关于ACQTEC
    • 公司介绍
    • 联系我们
    • 加入我们
  • DIC 知识库
    • DIC 数字图像相关原理
    • Application Notes 应用笔记
    • DIC Challenge 测试挑战
    • DIC 标准规范
    • Speckle Quality 关于散斑质量
    • Resolutions 关于DIC测量分辨率
  • 当前区域:
  • 首页
  • >
  • DIC 知识库
  • >
  • Application Notes 应用笔记

DIC 知识库

  • DIC 数字图像相关原理
  • Application Notes 应用笔记
  • DIC Challenge 测试挑战
  • DIC 标准规范
  • Speckle Quality 关于散斑质量
  • Resolutions 关于DIC测量分辨率

Processing Images for DIC Analysis

Processing Images for DIC Analysis
Posted by Micah Simonsen, Last modified by Micah Simonsen on 13 October 2016 01:04 PM


Sometimes, images acquired for use in 2D or 3D digital image correlation tests can be too dark; noisy; blurry; or aliased. From time to time we are asked whether it would be beneficial to process these images in software such as Photoshop to fix these issues.

 
In short, this is never beneficial. The information content of the image was set in stone as soon as it was sent from the camera to the PC; further adjustments can change the look of the image, but will not improve your correlation results and may possibly hurt them.
 
In the case of brightness, Vic-2D and Vic-3D will normalize the image internally; adding digital gain to the image will provide no benefit and may introduce quantization errors. Other processing (resizing, rotation, filtering) may cause problems because the interpolation algorithms in Vic-2D and Vic-3D are carefully designed to approximate known physical camera behaviors. Any soft postprocessing may create other artifacts.
 
If an image is too dark to see well for the purposes of drawing an AOI or viewing result overlays, you can use the Histogram control in the toolbar to adjust the look of the image. This does not affect the correlation, but can make the image much easier to see and draw on.


Batch Processing with VicPy

Posted by Nicholas Lovaas, Last modified by Micah Simonsen on 30 August 2018 08:27 AM

Using the VicPy module, we can create a batch processing mode just like in the example attached. Using this sample Python script we can open a Z3D project file, modify the project, save it, and then call Vic-3D to run it in Batch Mode. This can also be done using Vic-2D with some simple modifications. 


Continuous Surfaces in DIC

Posted by Elisha Byrne, Last modified by Micah Simonsen on 13 October 2016 01:08 PM

Because of how we track and match images in order to obtain data, and because of the fundamentals of strain theory, we must treat the area of interest as a continuous surface.  Discontinuous surfaces can result in unreliable data and erroneous strains.

Tracking and Matching Data

We apply a random speckle pattern to track our Area of Interest (this is the region of the specimen that you wish to obtain data).  We do not track the individual speckles, rather we track groups of pixels that we call Subsets.  The Subset size is user defined, but in this case let's consider a subset size of 21.  If we have a subset size of 21 pixels, this means that we are tracking squares of 21x21 pixels throughout the surface of the specimen.  In order to track and match these subset points, the subsets themselves must remain continuous.  If the subsets break apart or have discontinuous behavior, then we cannot track them.  Typically subsets that break apart (for example, when the surface cracks) will be dropped from the data, however what data is included in the contour plots is partially determined by factors like subset size and thresholding (which you can change in the Run menu).  What is even more problematic is that sometimes it looks like the subset was dropped near a crack, but some of that false data inside the crack is included in the nearest subset.  We report data in the center of the subset, so if the subset is 21x21, the edge of the contour plot will be a subset that includes 10 pixels outside of where the plot is drawn.  So some of the data that looks like it is outside of the crack, could potentially be including the crack, which would result in unreliable data.  The data within that crack is unreliable because strain theory assumes a continuous surface.

Strain Theory

Strain is a way to quantify how a continuous body deforms.  It is, very simply, the percent change in elongation and it is a measure of how ductile or rigid a material is (however, there are different types of strain tensors available in the software).  If you have a discontinuous surface, like a hole or a crack, if we correlate over that void or crack, then we are essentially putting strain gauges over the crack.  So as a material separates, it can show a huge "strain," but the material has broken so that is not strain, rather than just simply displacements of crack openings. When cracks or discontinuities in the surface occur, our software is designed to typically drop those points.  Again, we can control how much data we choose include with subset size and thresholding.  But we must be careful when looking at strains where there are discontinuous surfaces, because those could be erroneous due to the discontinuous material behavior.

Special Cases: Composites and Textiles

Some materials with a micro-structure, such as composites and textiles, can behave as a continuous material on a macrolevel but then have fibers slipping past each other and discontinuities on a smaller scale.  This is something to note because we could potentially see a shear strain due to materials slipping past each other, when it's, in fact, just slippage and not strain.  On a more macro level, however, the material is deforming as a continuous surface.  It's important to have an idea of how the material is deforming on both a micro and macro scale when looking at fibrous materials.


Multi-View Registration from Rigid Motions

Posted by Ian Adkins on 14 March 2019 10:36 AM


The principle behind using multi-view registration from rigid motions is to calibrate multiple systems separately, use rigid motions of a speckle pattern to determine the geometric transformations between each system, and use this transformation to merge data into the same coordinate system.

This app note will outline the procedure for completing a test using the multi-view registration to combine data from multiple systems.


Attachments  
 

AN1804 - Multi-View Registration from Rigid Motions.pdf (550.04 KB)


Vic Snap "Show Focus/contrast" feature

Posted by Elisha Byrne, Last modified by Elisha Byrne on 23 August 2017 10:50 AM

This feature was previously labeled "Show co-variance" and then "Show sigma estimate."

The "Show Focus/Contrast" feature may be selected by right clicking the live image in Vic-Snap.  The user is also given the option for three different subset sizes in the same menu.  This is used as a focus tool.  Specifically, this tool shows an estimate of the sigma (the one standard-deviation confidence interval) that is displayed in Vic-2D/3D results.  This sigma estimate simply estimates how easy it'll be to search and track subsets for the given focus/lighting. In order to provide live feedback, the sigma estimate requires less computing time than the sigma results that are provided in the Vic-2D/3D analysis.  Since it's computed in a different and simpler way, it will likely not match the sigma in the results (which is why we determined that labeling the feature "sigma estimate" was confusing and renamed it "focus/contrast"). 

The purpose of this tool is to provide the user some live feedback for focus (and also provides some feedback on pattern quality and lighting).  Specifically, this feature is a measure of the gradient between white and black. We assume that a sharp gradient from white to black means that we have good contrast and good focus. This is why it can be used as a focus tool. This is also why if the lights are moved or the brightness of the image is adjusted, it will results in a change in the "show focus/contrast" map. So if you are using it as a focus tool, you'll want the lighting (and exposure time) to remain fixed as you focus.


Lens Selection and Stereo Angle

Lens Selection and Stereo Angle
Posted by Elisha Byrne, Last modified by Micah Simonsen

Generally speaking, there are not many rules to setting up cameras, such as the stereo angle between cameras and lens selection because the calibration calculates all the parameters, such as stereo angle and focal length.  However there are a few things to keep in mind when setting up your stereo system.

1. For short lenses, use a large stereo angle.  The reason for this is that we get more noise around the edges of the image if a short lens is used with too small of a stereo angle.  This is explained in detail here (starting on slide 57): DIC-noise-bias.pdf

Rules of thumb for lens selection/stereo angle are here:

  • For shorter focal length lenses (8mm, 12mm), you should use a large stereo angle (at least 35 degrees, but the higher the better)
  • For mid-range focal length lenses (17mm), use at least a 25 degree stereo angle
  • For lenses 35mm or longer, it's acceptable to go down to a 15 degree stereo angle (for very long lenses, 10 degrees is OK).  Typically, a smaller stereo angle with longer lenses is actually preferred due to depth-of-field issues inherent to longer lenses/higher magnifications.

2. If you must use a small stereo angle with a short lens due to experimental constraints, keep the specimen in the center of the image.  The noise is much higher along the edges of the image when the stereo angle is too small.  In Vic-Snap, you can click the Toggle Lines on to help position the specimen in the center of the image.

3. Using a very large stereo angle can cause the surface to be so oblique to the sensor that the pattern is hard to extract.  It might present challenges with the depth of field too.  This is something you need to balance when having to use a large stereo angle due to lens selection.  The the pattern is very oblique to the sensor, you might have to use the Initial Guess feature to help the software with the match.

4. Correlated Solutions, Inc. spec's lenses and cameras together, making sure they are compatible.  We also test the lenses before they are spec'ed to make sure the lens quality is suitable for DIC.  Poor quality lenses can introduce noise into the system.  However, if the customer has other lenses they would like to use, it is suggested that the look up what sensor sizes it can cover and compare that to the sensor size of the camera in order to make sure the image circle of the lens properly covers the sensor with no vignetting.

5. For shorter lenses, you might need to select a higher Distortion Order in the Calibration Dialog.  More see: Troubleshooting Calibration Problems

6. For longer lenses/high magnification applications, you might need to select "High Magnification" in the Calibration Dialog if, and only if, the center x and center y values did not extract correctly.  More see: High Magnification Calibration


Using Gain in Vic-Snap

Posted by Micah Simonsen, Last modified by Micah Simonsen on 12 February 2019 03:57 PM

Please, don't. The increased noise will cause a dramatic increase in measurement noise.

DIC测量中永远不要使用图像增益进行采集!


2D Distortion Correction 光学畸变校正

Posted by Elisha Byrne, Last modified by Elisha Byrne on 16 August 2019 09:44 AM

The distortion correction module in Vic-2D uses an inverse mapping technique to correct for the complex distortions present in a single camera microscope imaging setup. The distortion correction module can also be used to correct distortions for other situations, like high distortion lenses and viewing through windows.

Attachments  
 

说明文档 AN611 - Distortion Correction in Vic-2D


Output Variables in Vic-2D and Vic-3D

Posted by Nick Lovaas on 16 December 2020 09:55 AM

Output Variables in Vic-2D and Vic-3D

During correlation and optional post-processing, Vic presents a wide range of output data available for 3D and contour plotting, extraction, and export. This application note gives an overview of commonly presented variables.

Output Variables

Always Present

  • X [mm] – metric position along the X-axis (by default, the horizontal axis).
  • Y [mm] – metric position along the Y-axis (by default, the vertical axis).
  • Z [mm] – metric position along the Z-axis (by default, the out-of-plane axis).
  • Sigma [pixel] – the 1-standard deviation confidence in the match, in pixels. 0 indicates a perfect match; higher numbers indicate a noise, excessive gradients, or possibly a failed match.
  • U [mm] – metric displacement along the X-axis, from the reference image. For the reference image, this value will always be 0.
  • V [mm] – metric displacement along the Y-axis.
  • W [mm] – metric displacement along the Z-axis.
  • x [pixel] – the X location, in the raw image, of the data point,
  • y [pixel] – the Y location, in the raw image, of the data point.
  • u [pixel] – the raw X-axis displacement between the reference image and a given image, in pixels. This is an internal variable which feeds into the triangulation algorithm to generate the 3D metric displacement data. Effectively, this variable is the output of a 2D correlation between the reference camera 0 image and the deformed camera 0 image.
  • v [pixel] – the raw Y-axis displacement between the reference image and a given image, in pixels.
  • q [pixel] – the raw X-axis disparity between the camera 0 image and camera 1 image, in pixels. This is an internal variable which feeds into the triangulation algorithm to generate the 3D metric shape data. Effectively, this variable is the output of a 2D correlation between the reference camera 0 image and a given camera 1 image.
  • r [pixel] – the raw Y-axis disparity between the camera 0 image and camera 1 image, in pixels.
  • q_ref [pixel] – this is the same as the computed X-axis disparity but is reserved for the software and cannot be edited by the user. This variable is used for retriangulation.
  • r_ref [pixel] – the reserved Y-axis disparity.

Strain Variables

  • exx [1] – strain in the X-direction. Positive numbers indicate tension; negative numbers indicate compression.
  • eyy [1] – strain in the Y-direction.
  • exy [1] – shear strain.
  • e1 [1] – the major principal strain.
  • e2 [1] – the minor principal strain.
  • gamma [1] – the principal strain angle, measure counterclockwise from the positive X-axis.

Velocity Variables

  • dU/dt [1] – the rate of change of the U-displacement; that is, the velocity of a given point in the X direction.
  • dV/dt [1] – velocity in the Y direction.
  • dW/dt [1] – velocity in the Z direction.
  • dExx/dt [1] – the rate of change of strain in X, or strain rate in X.
  • dEyy/dt [1] – the strain rate in Y.
  • dExy/dt [1] – the shear strain rate.
  • Note: principal strain rates are not calculated because principal strains, by nature, do not have a consistent reference frame from one image to the next.

Confidence Margins

  • Sigma_X [mm] – the 1-standard-deviation (67%) uncertainty in the X-axis.
  • Sigma_Y [mm] – the 1-standard-deviation (67%) uncertainty in the Y-axis.
  • Sigma_Z [mm] – the 1-standard-deviation (67%) uncertainty in the Z-axis.

2D-Specific Variables

  • x_c, y_c, u_c, v_c - these variables appear in the extraction dialog. If a scale calibration is present, they represent the scaled position and displacement. If no scale calibration is present, they're equal to the pixel values.

Deformed Variables (export only)

  • Xp – the deformed X value, equal to X+U. This is an option in the export dialog and is added for convenience.
  • Yp – the deformed Y value, equal to Y+V.
  • Zp – the deformed Z value, equal to Z+W.


VRO Calibration in Vic-3D

Posted by Micah Simonsen on 15 June 2021 11:30 AM

VRO Calibration in Vic-3D

Vic-3D 8 及更高版本新增了VRO校准选项,通过可变光线原点 (VRO) 相机模型来消除由于折射界面导致的成像测量偏差。 这对于涉及通过玻璃板(例如环境箱的观察窗)成像的设置或在生物医学应用中(样本浸没在水中)非常必要。 本文档概述了如何在 Vic-3D 中使用 VRO 模型执行校准。

Vic-3D 8 and later have a new calibration option using Variable Ray Origin (VRO) camera models to eliminate measurement bias when imaging through refractive surfaces. This is especially useful for setups that involve imaging through glass panes (e.g. a viewport of a heating chamber) or in bio-medical applications, where a specimen is submerged in water. This document outlines how to perform a calibration using the VRO model in Vic-3D.


Attachments  
 

说明文档 VRO_Calibration.pdf 


  • <<
  • 1
  • 2
  • 3
  • >>
  • 4000505810
DIC测量与检测
VIC-2D平面应变场测量
VIC-3D表面应变场测量
VIC-3D疲劳场与振动测量
VIC-VOLUME体应变测量
VIC-3D图像采集系统
VIC系统附件与辅助功能
Psylotech介观尺度/原位加载系统
isi-sys复材缺陷激光无损检测
MML原位微纳米力学测试系统
仿真建模与计算
SIMULIA 仿真模拟
BIOVIA 材料与生命科学
CATIA 设计
专用后处理模拟方案
解决方案
产品解决方案
行业解决方案
参考客户
工程与科研服务
DIC测量数据服务
残余应力测量
科研数据分析
支持与下载
申请试用
手册与彩页
试用下载
Online资料与培训
培训与支持申请
常见问题 Q_A
新闻与活动
活动计划
公司新闻
行业新闻
关于ACQTEC
公司介绍
联系我们
加入我们
DIC 知识库
DIC 数字图像相关原理
Application Notes 应用笔记
DIC Challenge 测试挑战
DIC 标准规范
Speckle Quality 关于散斑质量
Resolutions 关于DIC测量分辨率
ChatGPT OpenAI gpt4.0人工智能网页版 ChatGPT中文官网 ChatGPT4.0网页版 ChatGPT4.0中文网 GPT人工智能科普网 ChatGPT中文
Copyright ©2017-2022 ACQTEC Tel: 400-050-5810 研索仪器科技(上海)有限公司 沪ICP备17042497号-1